Dynamic Trend Gamma Squeeze for Tradier
Dynamic Trend Gamma Squeeze for Tradier
Dynamic Trend Gamma Squeeze for Tradier
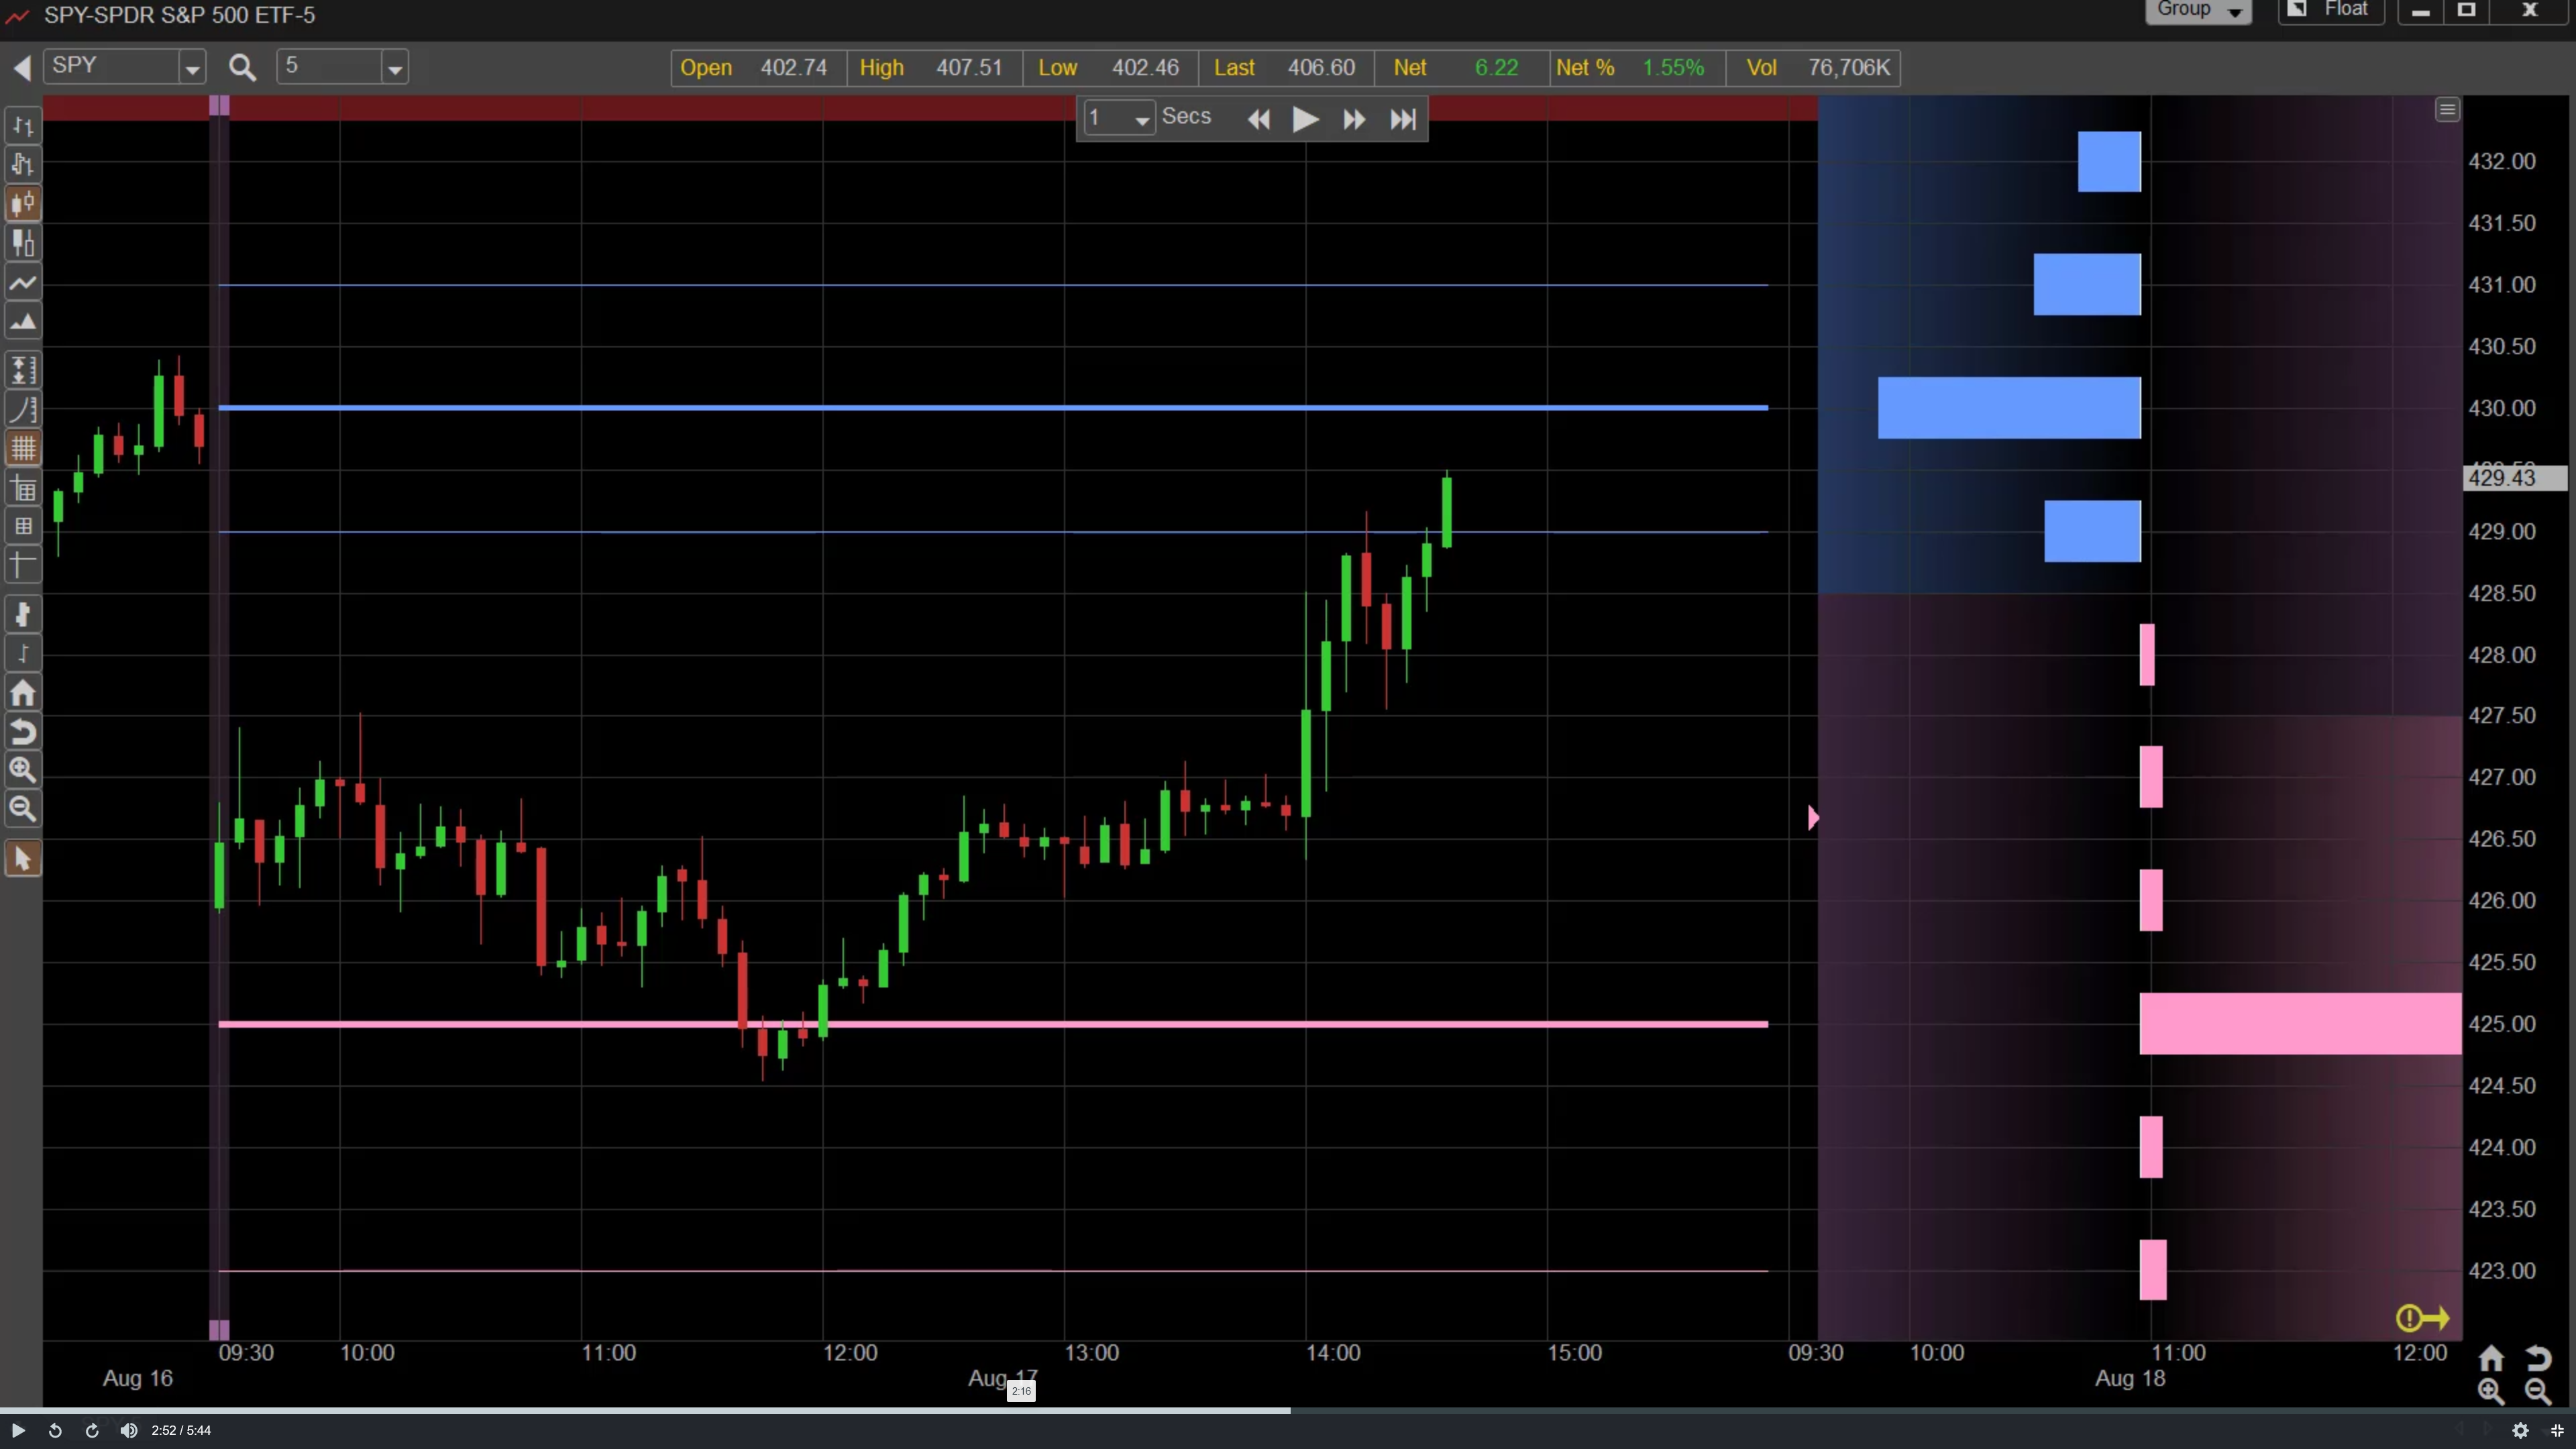
Market Indexes or very Active stocks with near term weekly options expirations tend to trade up or down in seemingly random moves to some price level only to reverse course on a dime. Our extensive research shows this phenomenon is mainly a result of Gamma Induced Squeeze levels on near term expiring options.
We have developed a unique method to combine multiple strikes and expirations to create a DT Gamma Squeeze Index. The DT Gamma Squeeze Index is either positive or negative.
Negative (Pink) or Positive (Blue) DT Gamma
When DT Gamma is positive, short sellers of calls will have to buy the underlying to hedge their short position. The amount of hedging depends on the Delta levels which in turn rises as Gamma rises.
In short, positive DT Gamma simply means that most of the hedging will be accomplished by buying the underlying.
Likewise, when DT Gamma is negative, most of the hedging will be accomplished by selling the underlying.
Large Clusters of DT Gamma
At certain strike levels, the accumulated DT Gamma Levels stand out as a Large Cluster. These large Cluster levels first become attractive/Magnet Levels.
Once the prices trade to these large Cluster levels, they become support levels.
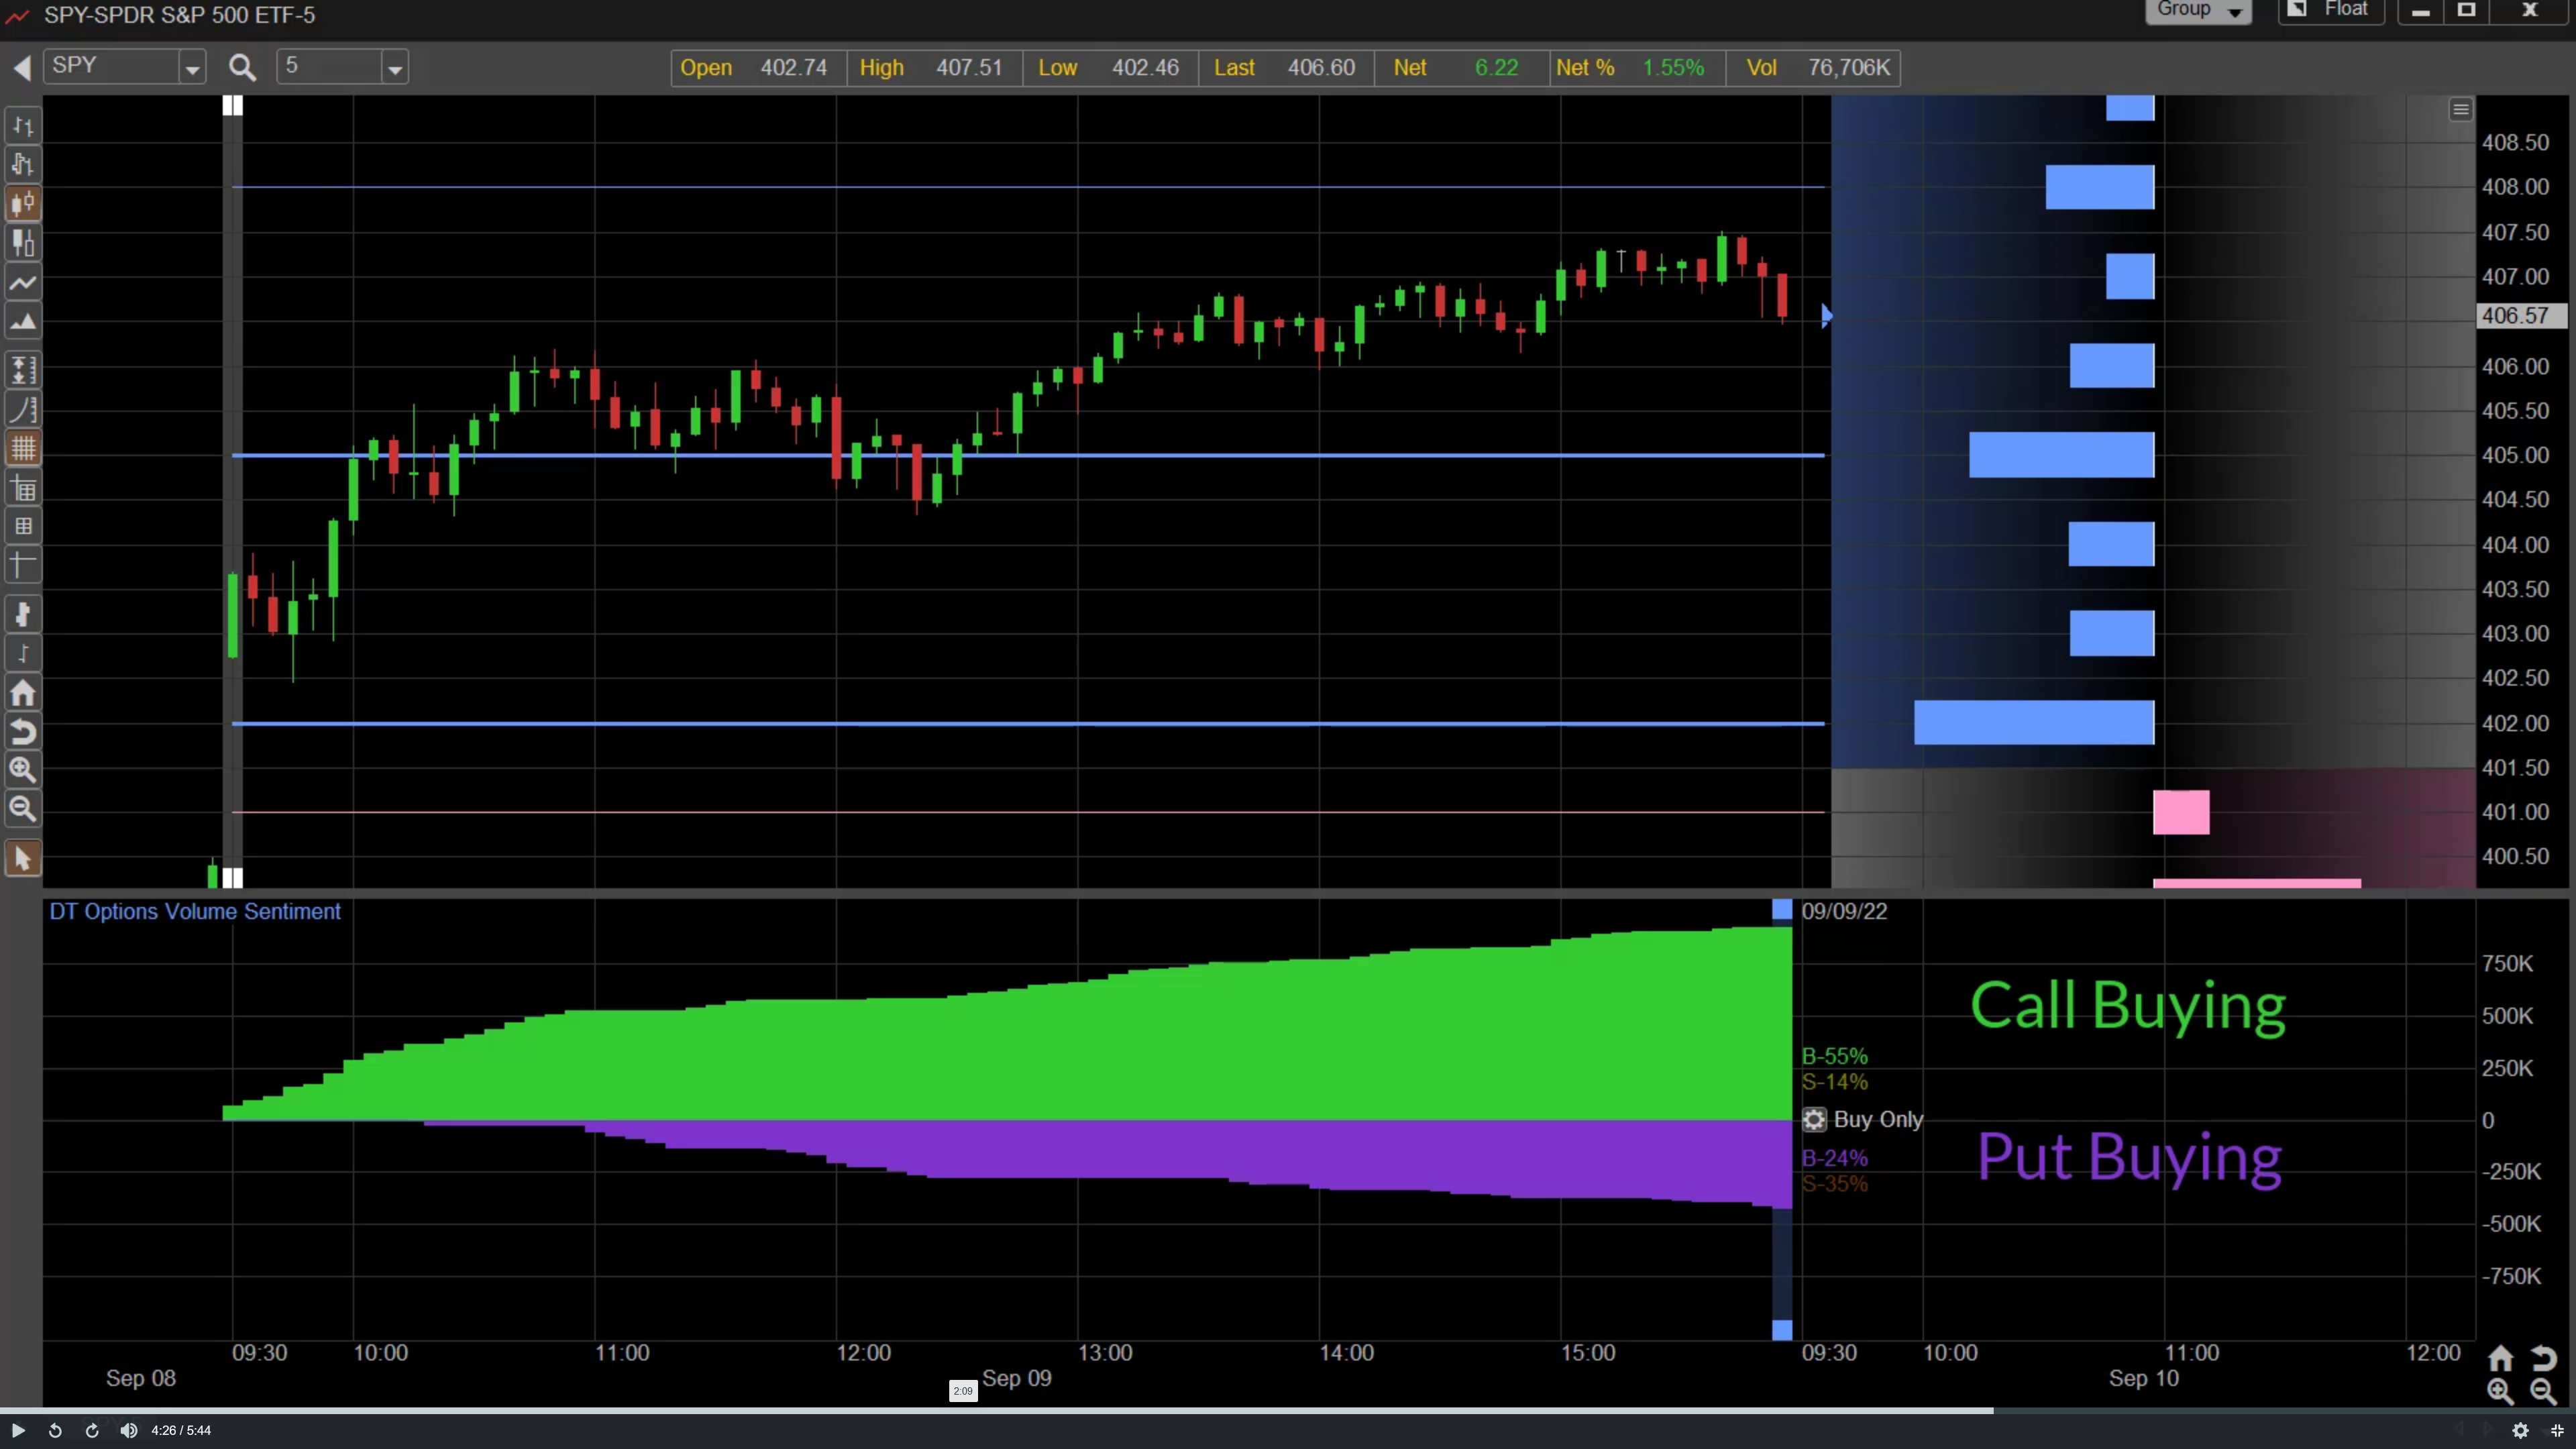
DT Options Volume Sentiment
The DT Options Volume Sentiment is a proprietary arrangement of Call Buying Sentiment vs Put Buying Sentiment. We look inside each bar for Options volume across multiple strikes in both calls and puts. Using this information, we can calculate the Call and Put Sentiment.
Here in this example, the Call Buying Sentiment far exceeds the Put Buying for the entire day.
When the 405 large Cluster Level of Positive DT Gamma (Blue) held as a major support, the Options Sentiment is heavily on the Call Buying side. This provides positive confirmation from actual Options Trading in various strikes at that time.
Dynamic Trend Disclosure/Disclaimer
No offer or solicitation to buy or sell securities, securities derivative or futures products of any kind, or any type of trading or investment advice, recommendation or strategy, is made, given or implied with any information made available on this Website. This product uses highly complex forms of analysis that are based on theories and historical analysis, and therefore, is by their nature, untested and unproven as to future performance. This product does not provide specific trading recommendations. Rather, it is a framework of technical and historical analysis, which requires you to make a variety of critical decisions that determine how the product will react to market conditions.
Hypothetical or simulated performance results have many inherent limitations. Unlike an actual performance record, simulated results do not represent actual trading. In fact, there are frequently sharp differences between hypothetical performance results and the actual results achieved by any particular trading program. Also, since the trades have not actually been executed, the results may have been under or over compensated for the impact, if any, of certain market factors, such as liquidity. Hypothetical or simulated trading programs in general are also subject to the fact that they are designed with the benefit of hindsight. No representation is being made that any account will, or is likely to, achieve profits of losses similar to those shown. Hypothetical trading does not involve financial risk and hypothetical trading record cannot completely account for the impact of financial risk in actual trading. Futures, stocks, or options on futures or stocks, or stock indices, or mutual funds, or any other financial instruments involve a high degree of inherent risk and the possibility for loss is great. All investments and trades carry risks, and all trading decisions are ultimately made by you and you are solely and individually responsible for the decisions and the results of those decisions.


